
When looking to develop a marketable product, one of the first questions should be how to determine features that will distinguish the product from others. Kano Analysis is how those market movers are found. But more than that, it helps recognize which features are essential to gain customer satisfaction.
The point of Kano Analysis is to determine what will drive market demand in a product. One thing that is interesting about Kano is that it isn’t a one time thing because the results shift over time. Like most things in Agile, revisiting previous results can lead you to finding a shift in what drives vs what is expected vs what you should avoid.
Kano Analysis Graph

Here’s the grid for Kano Analysis. On one axis is the Degree of Achievement. The other is Customer Satisfaction. So Kano measures things in 3 attributes:
Kano Attributes

- Excitement – The more of this you do, the more excited customers get along an exponential curve. These are the game changers
- Performance – These are things that go along a linear curve. People expect to see these attributes.
- Threshold – These are things that don’t get people excited. But if you don’t have them, they get disappointed. Again, it is an exponential curve, but it flattens out as you Achieve it. These are assumed without mention sometimes, and are absolutely necessary.
Additional Elements

There is a 4th characteristic called “Indifferent” Addressing these would be seen as wasteful. They might be viewed as a negative – a downward arrow. Kano doesn’t show these.
To determine which of these 3 dimensions a capability belongs involves a survey. On a 5 point scale 2 questions. The Functional form question – how do you feel if this is present. And the Dysfunctional form – How do you feel if it is not present.
The 5 point scale is shown ranging from “I like it that way” to “I dislike it that way.”
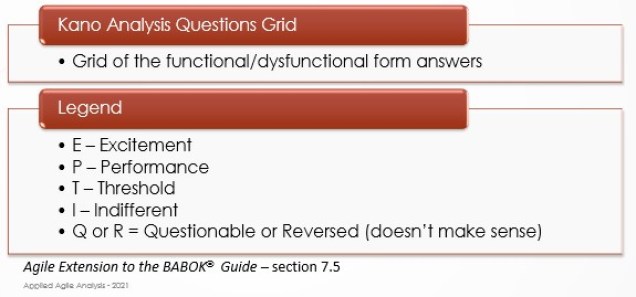
The answers are put on a “Kano Analysis Questions Grid” which I’ll show you in a minute. And from there we can see what builds along the 4 characteristics we mentioned earlier.
Kano Analysis Grid

So if you’ve looked at a sample of several surveys, you will see a pattern on how the respondents like or dislike a feature. For example, if most of the answers fit into Functional Expect and Dysfunctional Dislike – That would mean this feature is a T – Threshold.
If it is functional Like and dysfunctional Expect – that means they DON’T expect it (it is a dysfunctional expect), but they do Like it. They’ve not seen this often, but they want it. These are the big market movers. If it is a Dysfunctional Neutral or Live With, these are still on the Excitement curve, but perhaps not as strongly.
You can see, this is a very powerful market analysis tool.
Description

Here is the Kano Analysis description. We’ve covered this pretty well but I want to highlight the Context and Audience.
This is in the Product Management or Refinement context because we will use this technique to determine what to include or exclude from the product, as well as what has the highest priority.
And since the surveys are from External Stakeholders, this can be a great communication tool to find out from them what is desired, and communicate what we are going to address first.
Usage Considerations

One thing to highlight is, this technique is not to be used in a vacuum. There can be other factors that determine priority.
Another thing is today’s perceptions may shift over time as features become more commonly accepted. So the phrase “strike while the iron is hot” may be applied to the findings of Kano, meaning act while you can get ahead of the competition.